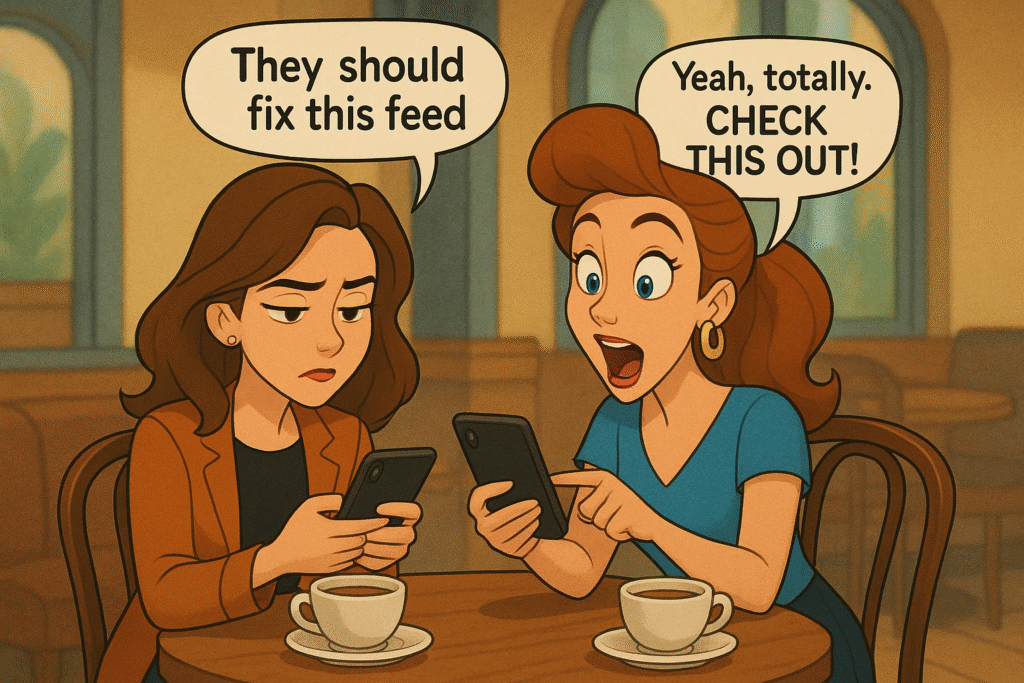
How Instagram proved that customer requests can be the worst product strategy
I spent half an hour last week listening to a product manager defend their latest feature update.
“But the users keep requesting it,” she insisted, scrolling through dozens of support tickets and forum posts. “Look — they’re literally telling us exactly what they want.”
That’s when I told her about Instagram’s chronological feed fiasco.
For years, Instagram users demanded the return of chronological feeds. They hated the algorithm.
They complained constantly about missing posts from friends.
They begged for the “good old days” when everything showed in order.
The feedback was overwhelming, persistent, and totally wrong.
When Insta finally gave users what they claimed to want — a chronological feed option — adoption was virtually nonexistent.
Despite all the vocal demands, users engaged 90% more with algorithmic content compared to the chronological alternative they’d supposedly been craving so bad.
The lesson:
What customers say they want and what they will actually use live in completely different universes.
This pattern repeats across pretty much EVERY tech platform.
The say-do divide is massive.
Zoom documented a “fatigue paradox” where 49% of professionals reported exhaustion from video calls, yet usage increased dramatically — with 63% participating in more online meetings than they would have attended in person.
The disconnect shows us something wild: stated preferences reflect aspirational usage, not for-real value perception.
Microsoft Teams versus Slack tells an even crazier story. Teams consistently shows higher satisfaction in enterprise surveys, yet 66% of companies using Teams simultaneously adopted Slack for daily communication.
Behavioral data gave the truth — 92% of engaged Slack users utilized group messaging versus only 11% for Teams!
The vocal minority effect explains why this happens.
Product managers report that only 20% of requested features see regular usage, yet feedback from less than 5% of users drives 50% of product decisions when behavioral data isn’t prioritized.
In I Need That, I get into how much faster our dog brain operates than our tank brain in making decisions. Survey responses come from careful tank brain deliberation — what we think we should want.
But actual usage decisions happen in milliseconds, driven by what our dog brain finds genuinely engaging.
Product Payoff: By ignoring user complaints about its “Discover Weekly” algorithm, Spotify learned this lesson. Despite feedback claiming the suggestions were “too repetitive” or “not diverse enough,” behavioral data showed users engaged with algorithmically curated playlists 40% more than manually created ones!
Rather than adjusting based on complaints, Spotify doubled down on algorithmic curation.
Start with this: Identify your most frequently requested feature. Before building it, test actual usage patterns with a simple prototype or beta version.
Measure engagement. You might discover that your loudest feedback comes from users who wouldn’t really use what they’re requesting.
Talk is cheap. Product development, not so much!
Tomorrow: How smart companies stopped asking customers what they want and started watching what they actually do.
Have you ever built a feature that users requested, then rarely used?
Tap that reply arrow and share your experience with the gap between user feedback and real-life behavior.
Or reach out to my team of product strategy consultants at Graphos Product.
